
Introduction/Background
Cryptocurrencies, or virtual currencies, are digital means of exchange that use cryptography for security. The word ‘crypto’ comes from the ancient greek word, ‘kryptós’, which means hidden or private. A digital currency that is created and used by private individuals or groups has multiple benefits. Currently, cryptocurrencies can be divided into three categories: Bitcoin, altcoins (anything other than Bitcoin that has value), and shitcoins (coins with ultimately no value).
The term shitcoin refers to a cryptocurrency with little to no value or a digital currency that has no immediate, discernible purpose. Shitcoins are characterized by short-term price increases followed by nosedives caused by investors who want to capitalize on short-term gains. As such, these currencies are considered to be bad investments. Shitcoins are also sometimes referred to as Memecoins.
Problem definition
Shitcoins have their pros and cons, as the purpose is for small investors who like to take risk and flip their money in efforts to make a 100-1000% increase in profit returns. The cons come in where the creators of these shitcoins often rug out the coin, meaning they initially own a very large portion of the coin, wait for a series of investments, then sell immediately causing those new investors to lose most of their money and make no profit. Other ways rugs can be detected are through fraudulent contracts, but we will focus on the large account holders.
Previous models, such as [1], have used linear models, random forests (RFs), and SVMs to forecast prices of the Bitcoin and altcoins but have given little attention to shitcoins.
Our goal is to use predictive analysis techniques to help indicate whether a coin is a potential memecoin or not, which can be determined by looking at all the recent transaction histories, holders, and contracts of the coin [2][3]. We will look at coins that have already been classified as memecoins and ones that are still going strong to help with future coins. This will be valuable to evaluate the risk of investments into these shitcoins.
Dataset Collection
The data collection process is the most important and crucial part of this project, which is also why it was also the most difficult portion. Our problem relies on a significant amount of data and features to determine whether or not a cryptocurrency is a meme coin or a scam. We ended up using various web scraping tools and tedious data scraping without tools to acquire all the needed data. The data collected includes Bitcoin, altcoins, and memecoins. Certain cryptocurrencies have limited information simply due to lack of professional development, which itself is a feature we have included (lack of credibility). The other features used include the coin symbol, price, volume, market cap, coingecko rank, volume to market cap ratio, dominance, social media coingecko likes, fully diluted valuation, and whether it’s a memecoin.
Since data came from differing sources, we ended up having entries with more or less data than needed. After the collection of the data, we had to clean everything and unify the formatting to give us a clean and flushed out dataset. This is discussed in the following section.
Dataset Processing
Before any feature sensitivity analysis, we first did some data clean up. The following is a snapshot of our full dataset which contains 2395 cryptocurrencies and 11 features:
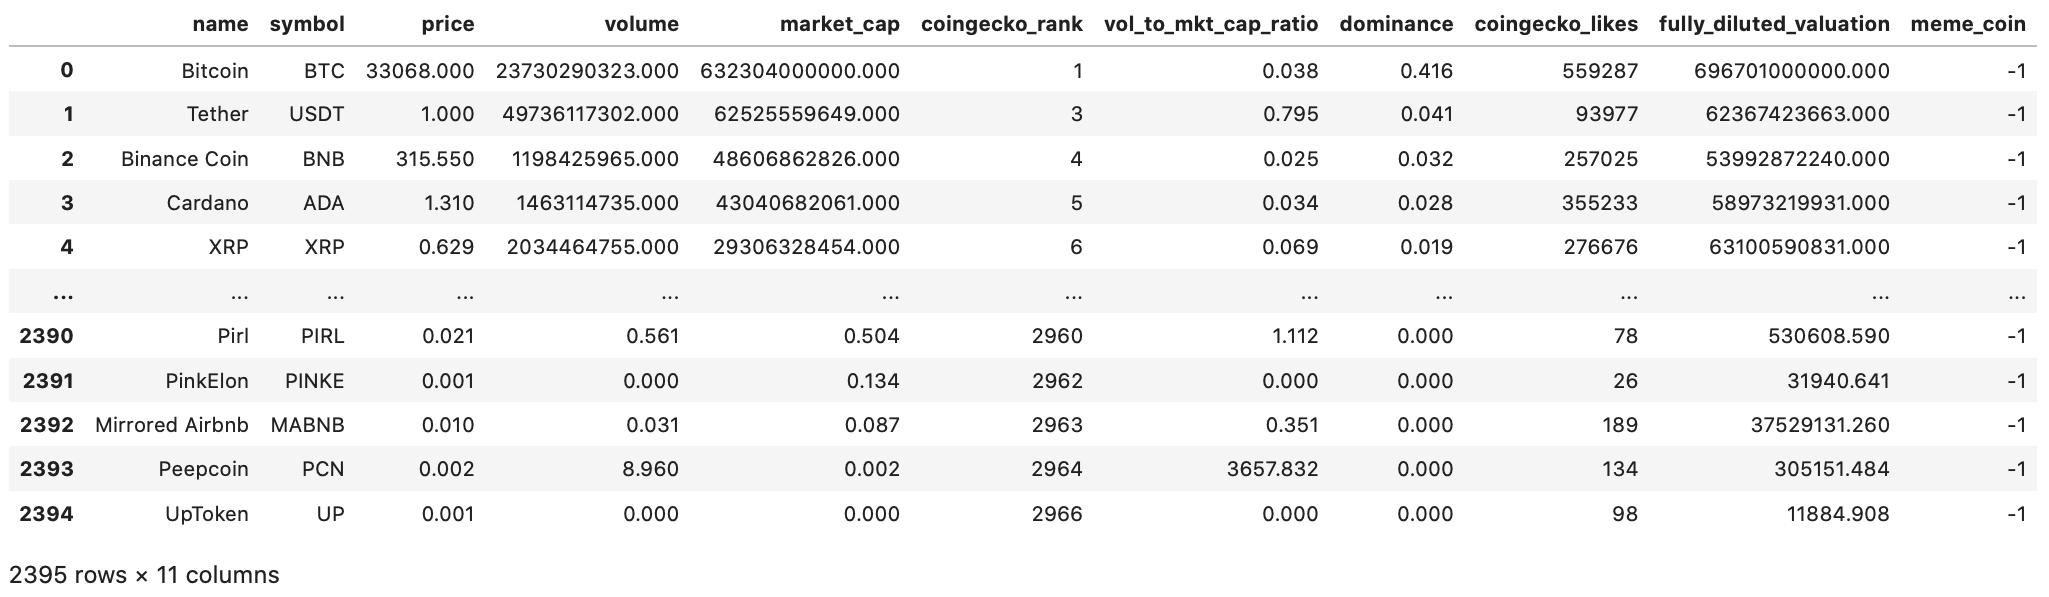
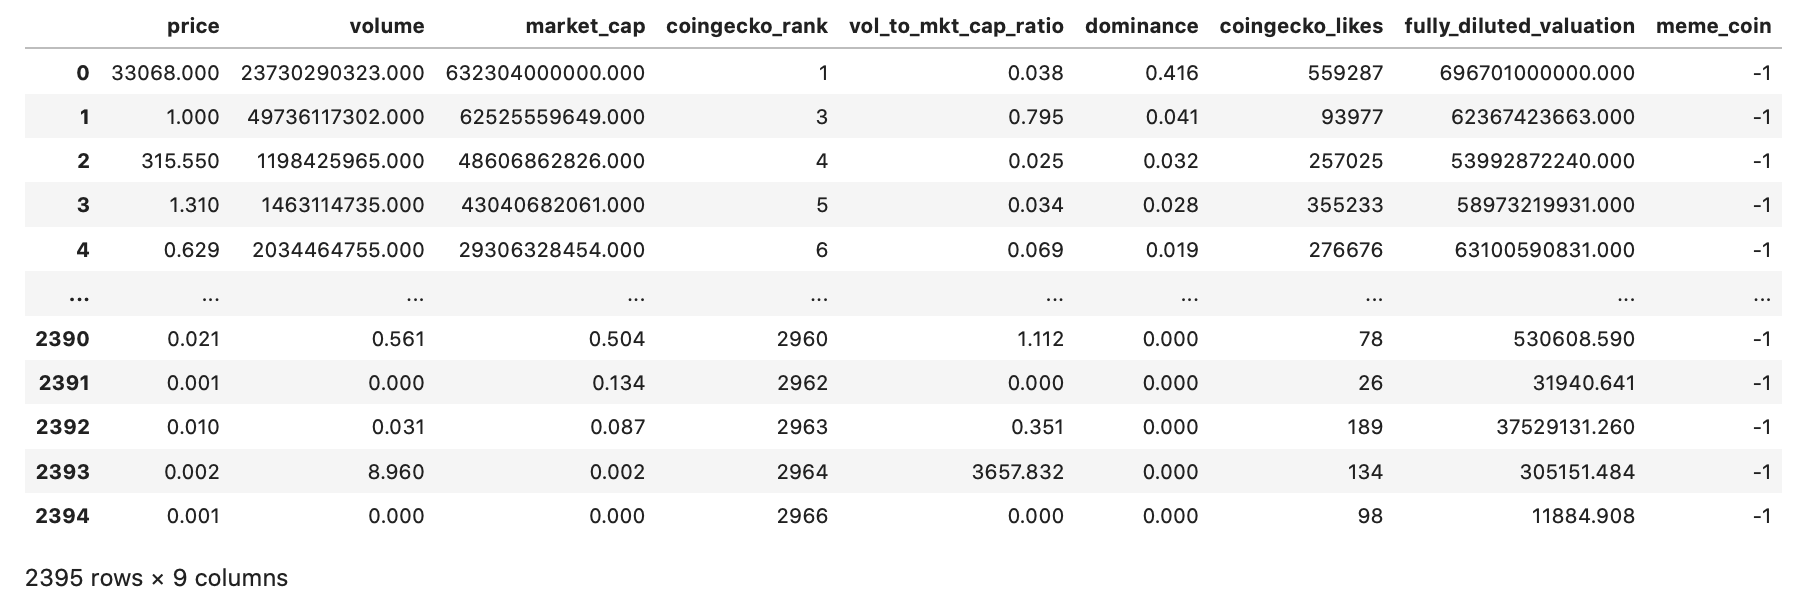
The features that were dropped were the coin names and coin symbols. These features were unique to each coin and is irrelevant to our success metrics. Furthermore, the meme_coin field was converted to integer values, such that NOT-MEME-COIN=’-1’ & MEME-COIN=’1’. The following is a snapshot of the cleaned dataset:
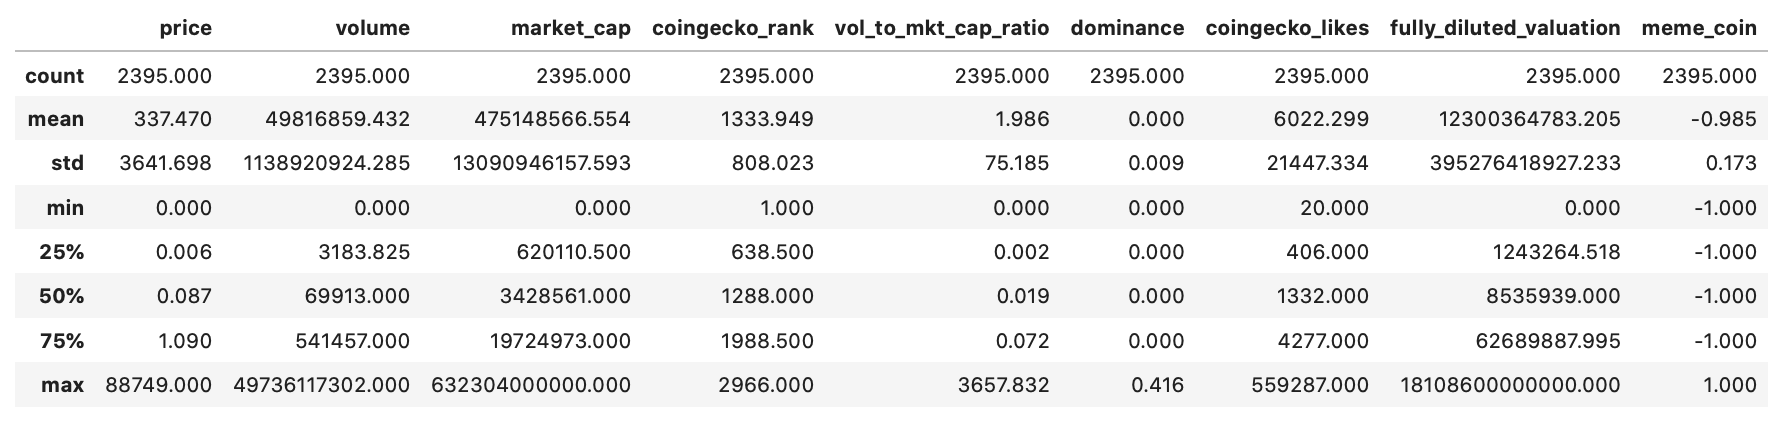
As a result of obtaining and scraping data points from several sources, there were some irregularities in the data. To display these anomalies, we displayed the description of the data and obtained the mean, standard deviation, minimum, and maximum of each feature in our dataset. The table below shows the statistics for each of the features. As can be seen, there are several anomalies in the dataset which can be identified. For example, the minimum price is seen to be 0, although this is not mostly accurate.
Dataset Visualization
It is important to know the distributions of the features in the dataset in order to choose the most appropriate machine learning models to train. After dataset cleaning and processing, the dataset contained 9 unique features that will be used in our models. Feature distribution analysis, class correlation, and feature correlation were done on the dataset to further understand the data points.
The distribution of each feature is a very important aspect in understanding the correlation in the dataset. Below are distribution graphs for each of our 9 features:
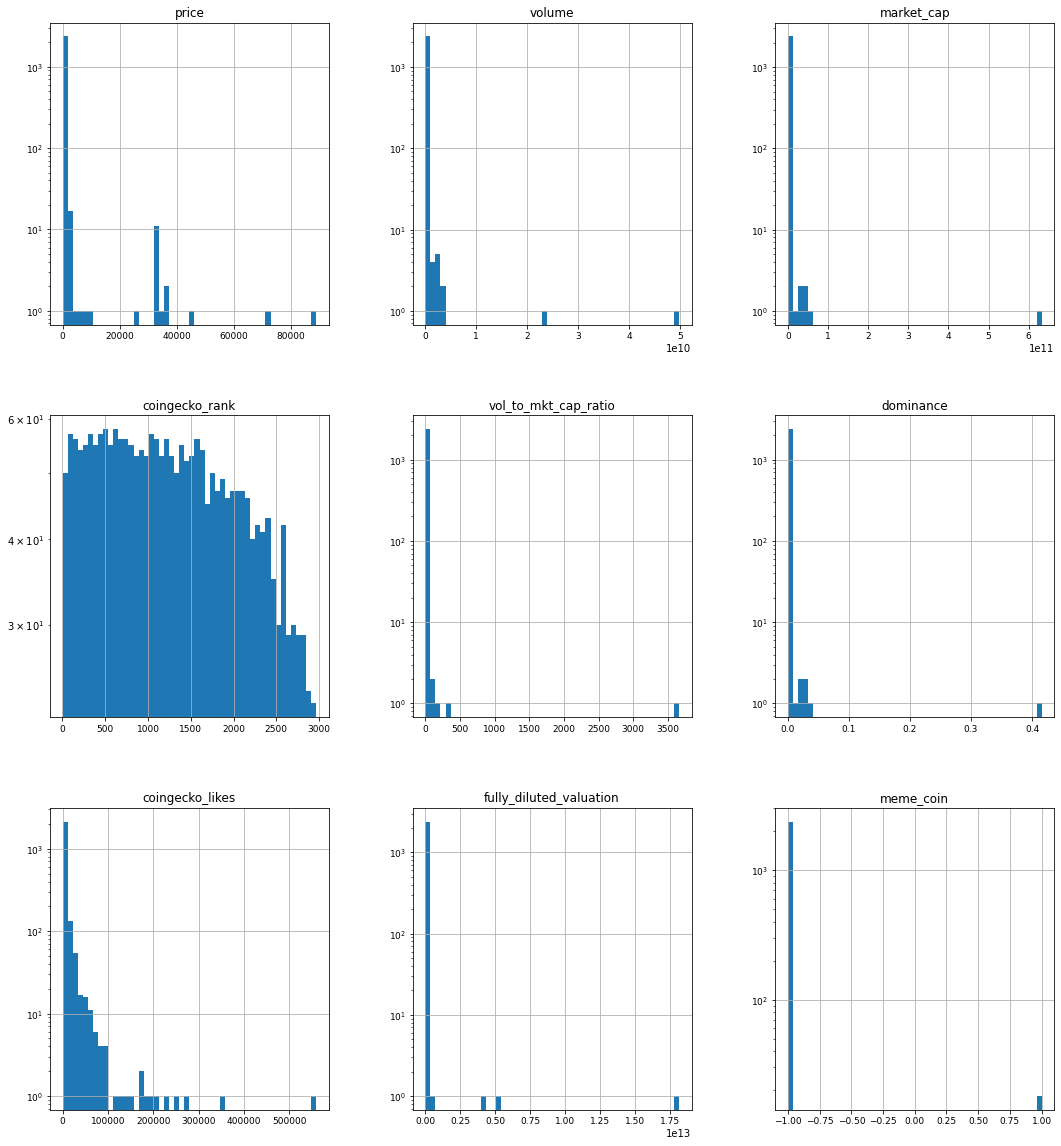
From the visualizations of feature distribution, we can see that the features are not linearly distributed, hence further distribution and correlation analysis can be greatly important. One of the most useful correlation indicators is the Correlation Matrix, where we can visualize the feature correlation present in the dataset. The following displays the correlation matrix for the dataset:
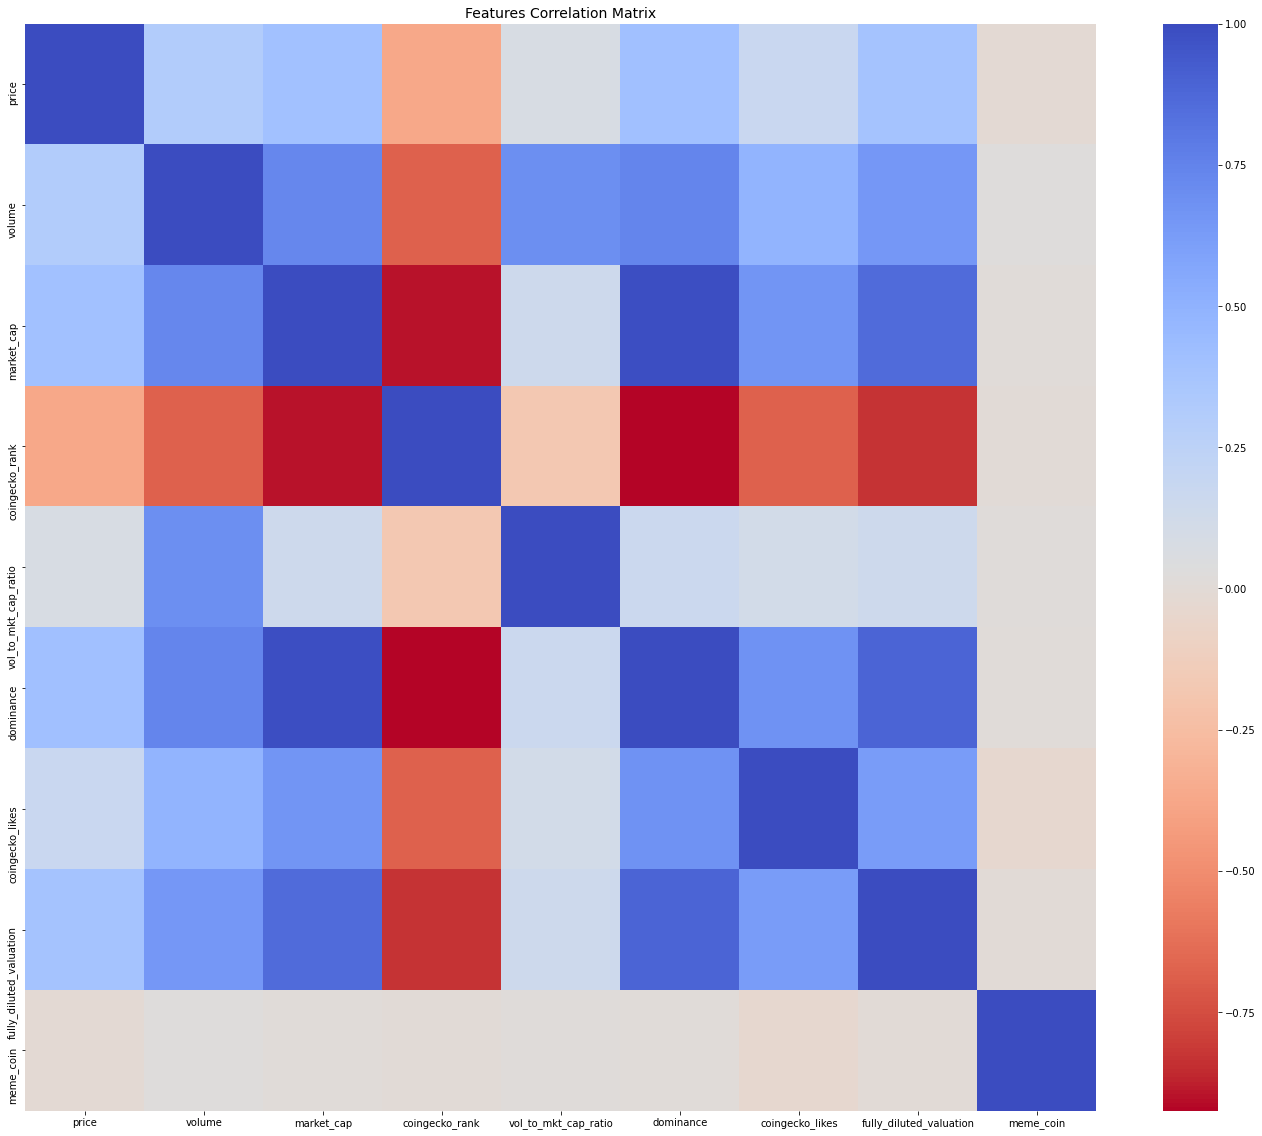
The correlation matrix provided very important details as to how the features intertwine together in the dataset. Since our project goal is to identify whether a coin is a memecoin or not, it is as well important to evaluate the correlation of each feature against the meme_coin classification feature. The following set of graphs show the class correlation between each of the 9 features with the meme_coin classification feature:
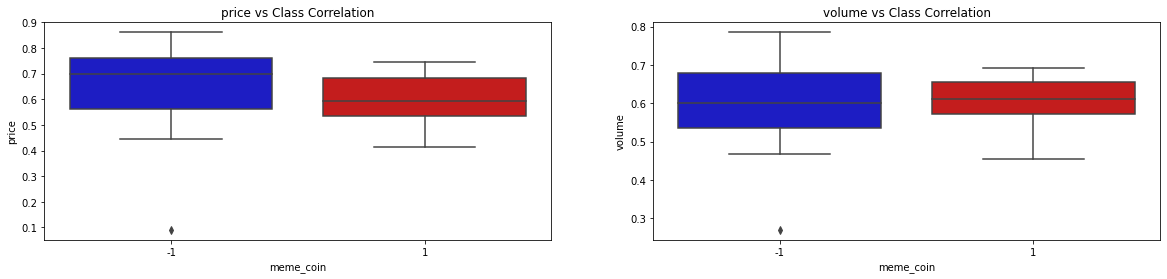
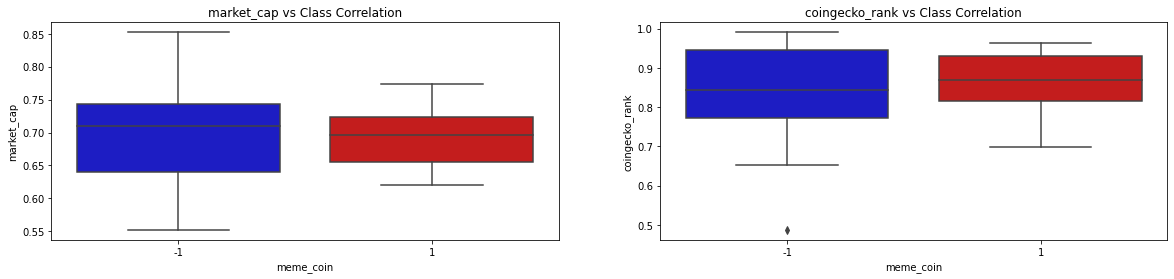
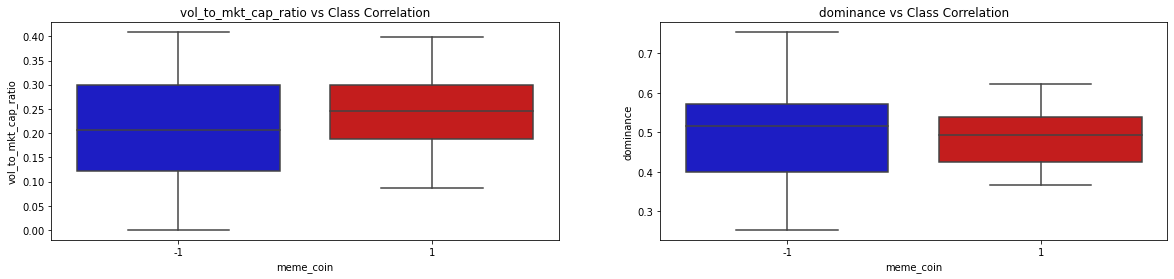
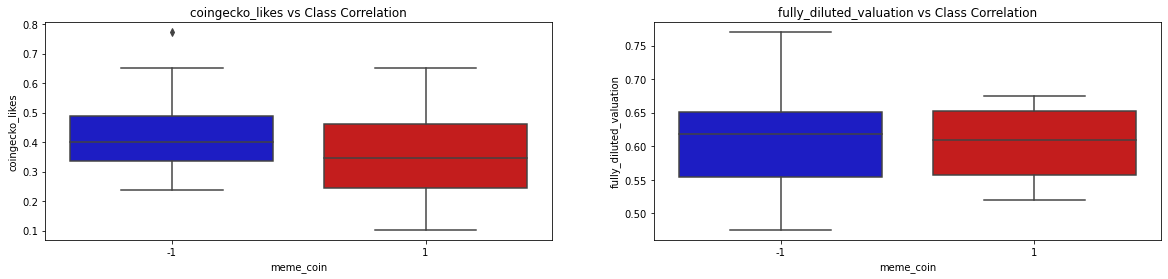
By looking at the correlation of the 9 features with the rugged feature as well as the correlation matrix, we get a clearer picture of the distributions, correlations, and usefulness of the features in our model to predict if a cryptocurrency is memecoin or not. The coingecko_rank and coingecko_likes features are highly positively correlated with memecoin. This makes sense since less professional and social presence of a cryptocurrency, the higher the risk of the coin being a memecoin. On the other hand, the fully_diluted_valuation feature is highly negatively correlated with rugged. This as well makes sense because the higher the diluted valuation then the lower the risk of the coin being a memecoin. The other features in our dataset have a slight positive/negative correlation with the memecoin feature.
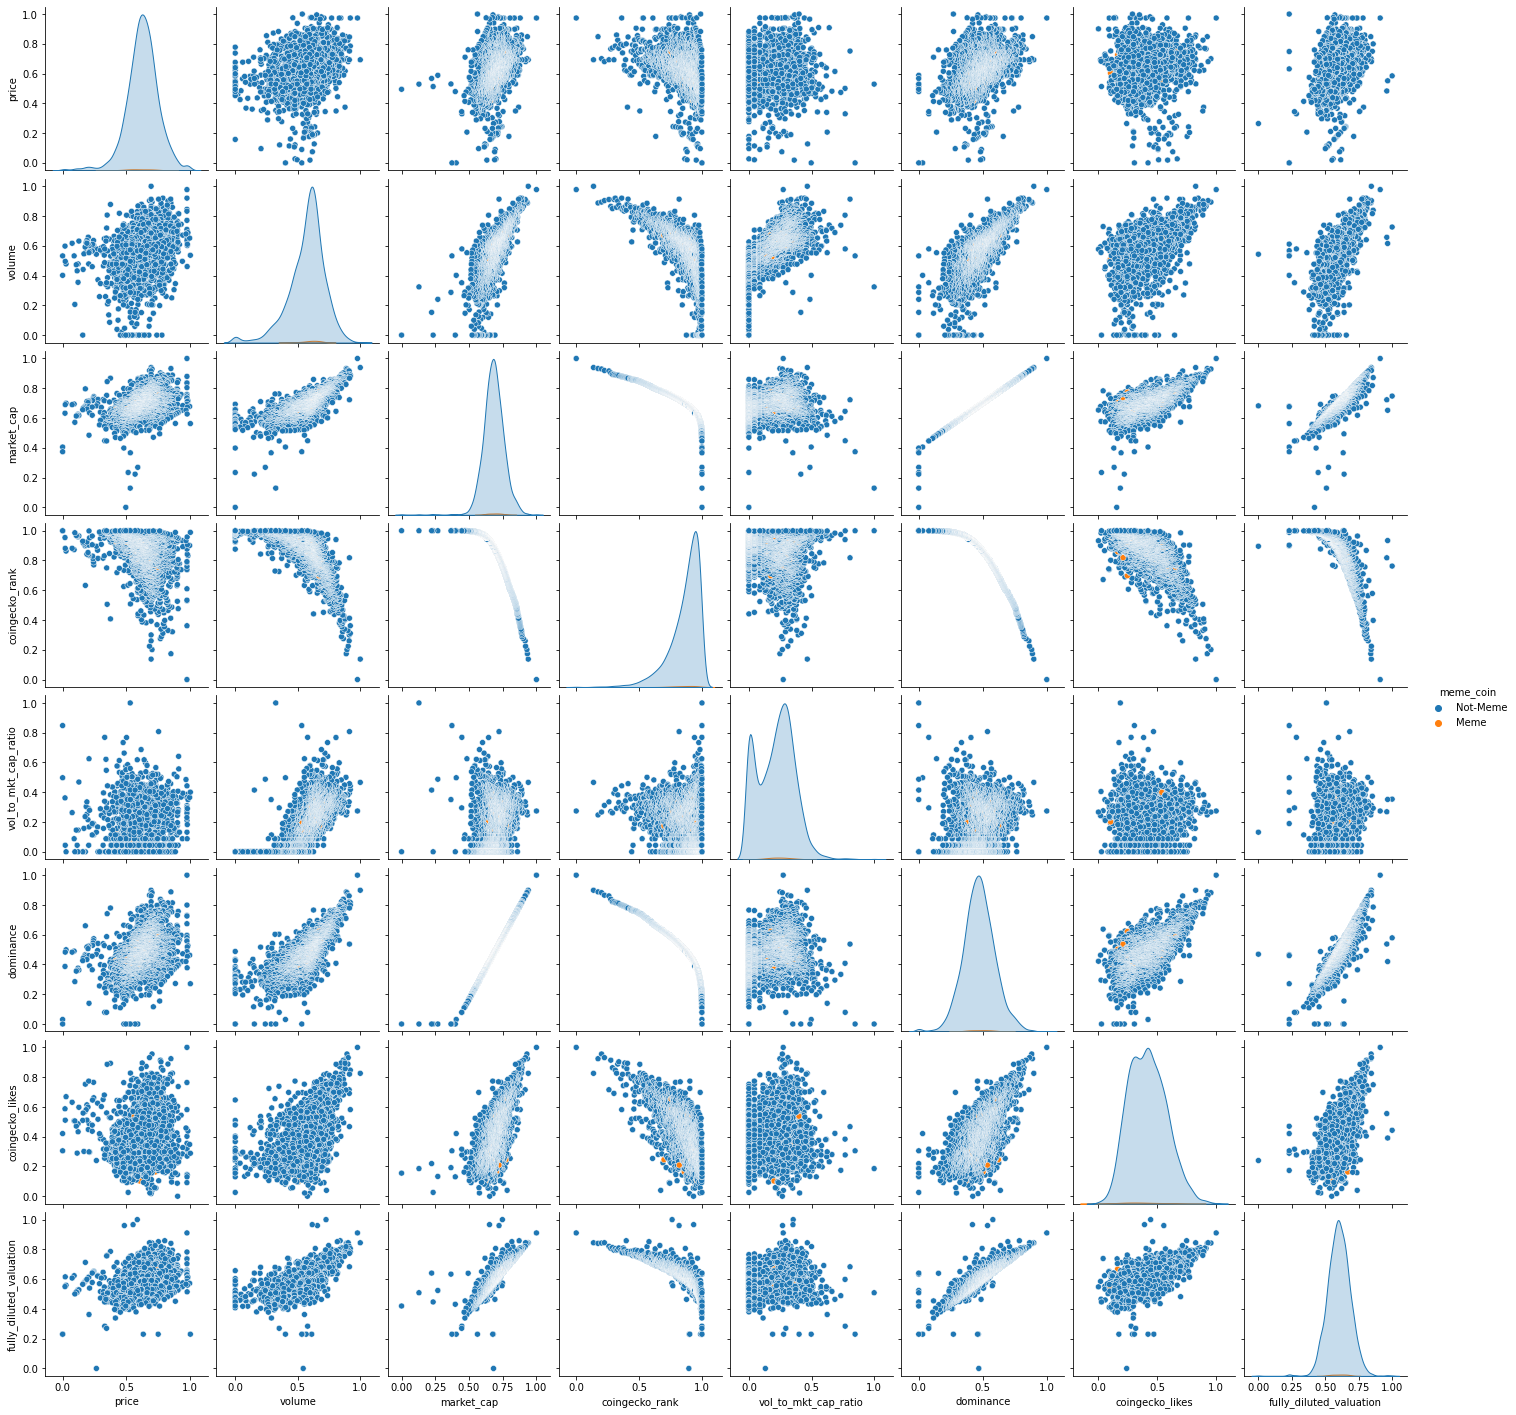
The following is the complete correlation matrix of the dataset, with the feature distribution graphs on the diagonal, after scaling and normalizing the dataset:
Methods and Results
Principle Component Analysis (PCA)
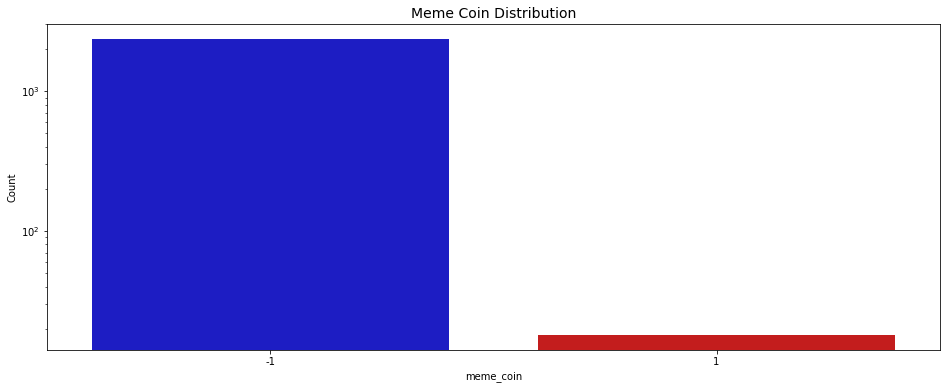
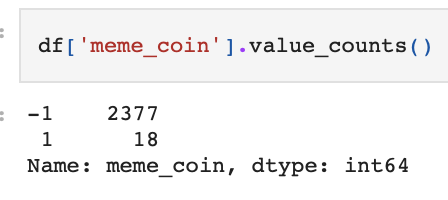
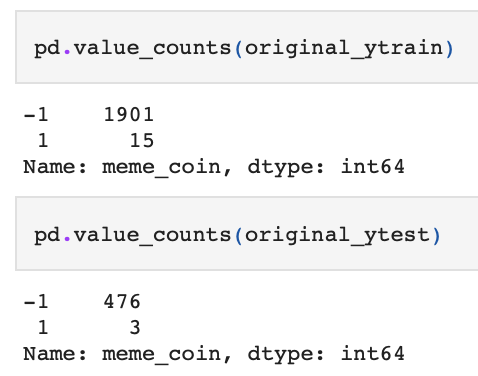
Due to the nature of the two options output (TRUE, FALSE) produced by the algorithm, this problem is a binary classification problem. As part of our unsupervised learning approach, we used PCA (Principal Component Analysis). PCA is used for reducing the amount of dimensions within a dataset, increasing interpretability but at the same time minimizing information loss. We aim to optimize the number of features used in the prediction by using PCA. We use the classic 80/20 training/testing split. The following is the count of data points classified memecoin or not, as well as the split of training and testing data:
The ML performance metrics that were used to evaluate our model were Accuracy, Balanced-Accuracy, Macro-Precision, Precision, Macro-Recall, Recall, Macro-F1, F1, Macro-ROC, and ROC. After using PCA to train the model for 20 full iterations (each taking ~5sec), the following is the results of the model (arranged in ascending order according to F1-Score):
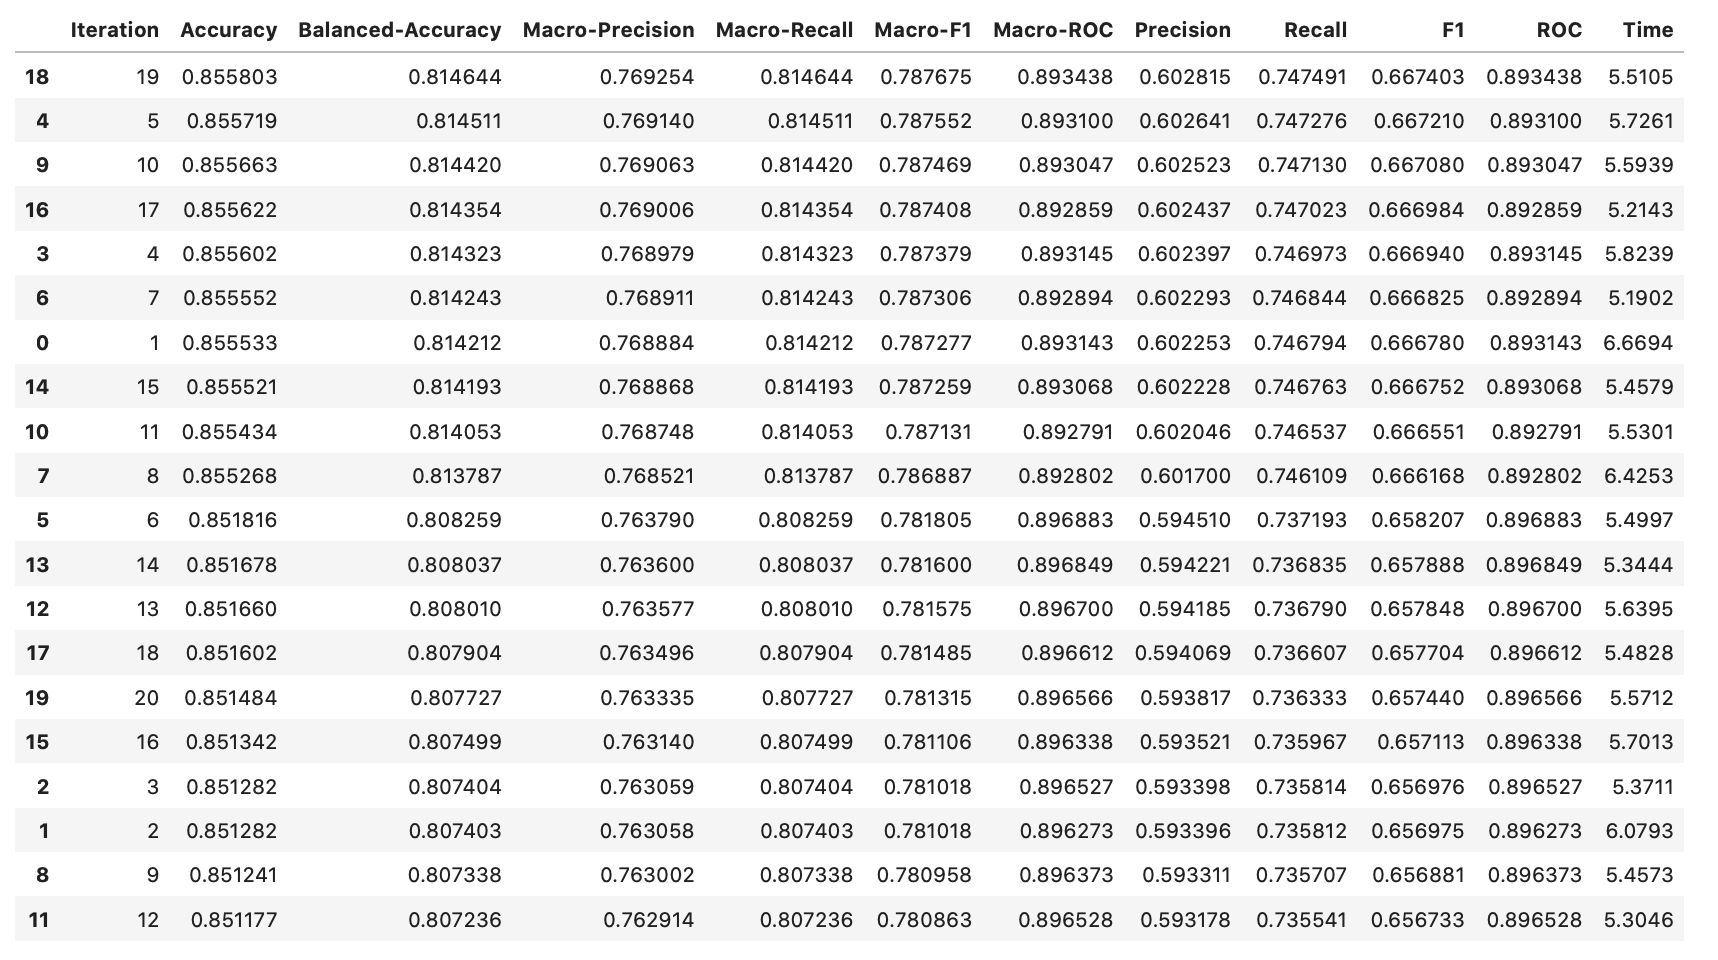
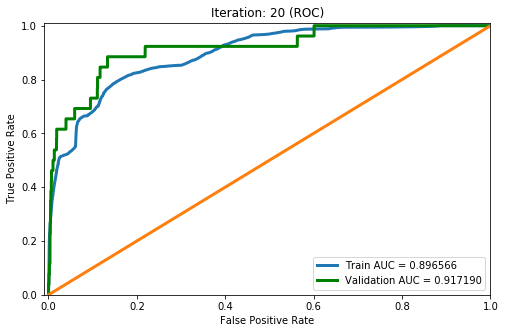
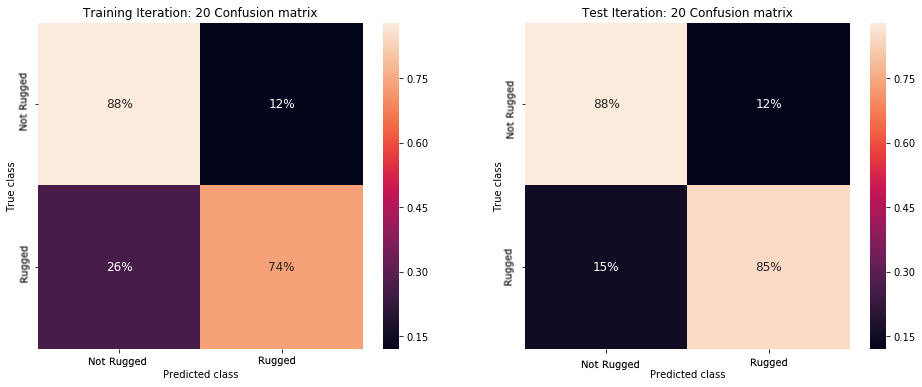
These results show high accuracy, through several ML performance metrics, for the PCA model. The model achieved a high of 0.855803 for accuracy, 0.814644 for balanced accuracy, 0.769254 for macro precision, 0.814644 for macro recall, 0.787675 for macro F1, 0.893438 for macro ROC, 0.602815 for precision, 0.747491 for recall, 0.667403 for F1, and 0.893438 for ROC. To have a deeper look at the results of the iterations, below is the ROC graph and Confusion Matrix for iteration 20 (final iteration):
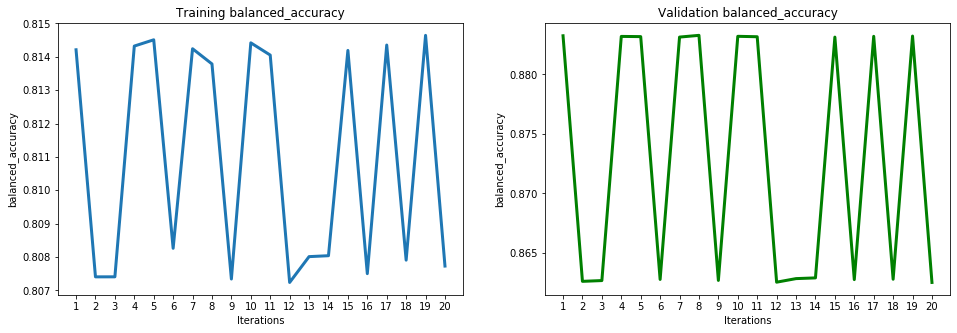
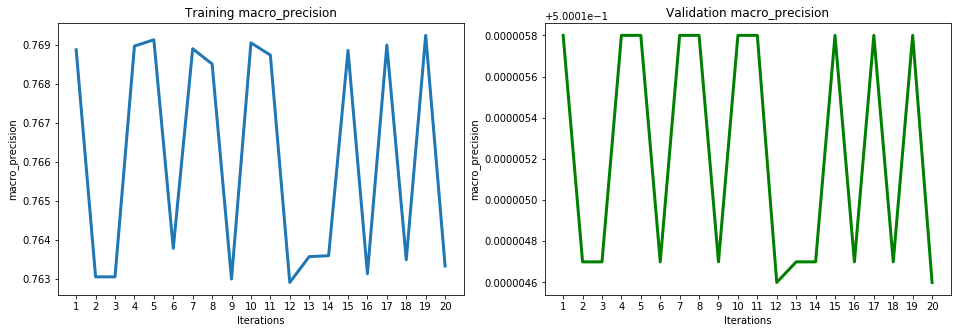
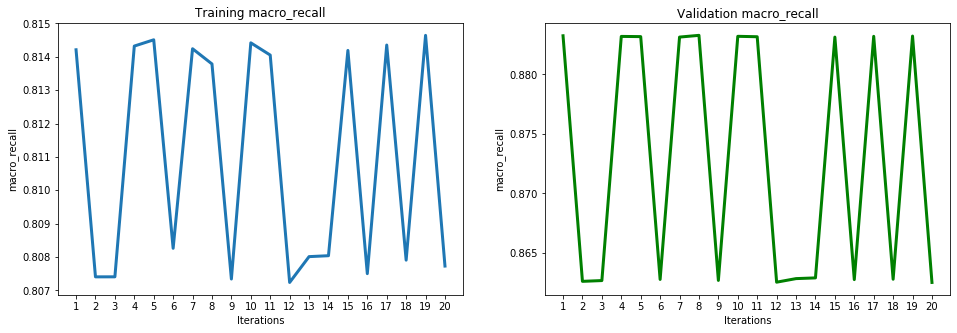
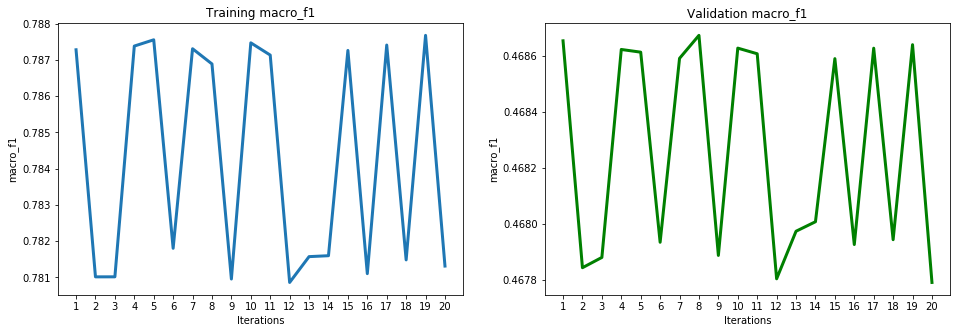
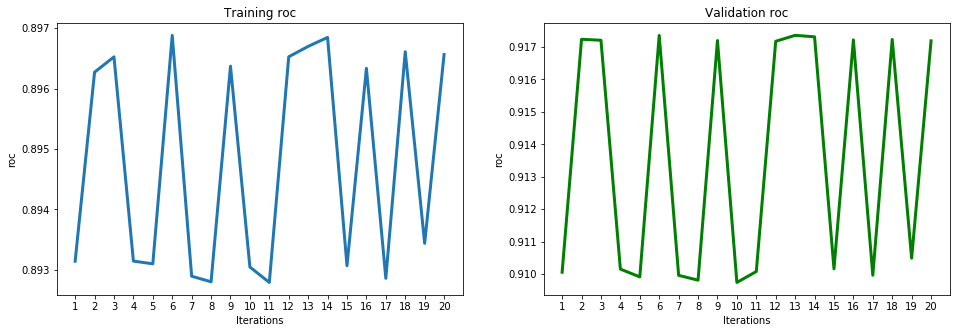
The performance evaluation of PCA using the ML metrics chosen were displayed in the previous table of results. The below graphs display more detail of the performance evaluation of the testing and training sets using each metric:
Support Vector Machines (SVM)
SVM is a type of supervised learning technique that is largely used in classification problems. We applied SVM by plotting all of the data points in n-dimensional space (where n = features) with the value of each feature being a coordinate. The classification comes in through the foundation of a hyperplane that intersects the graph of the plotted points, splitting the graph into two separate classes. Prior to applying SVM, we scaled our data to help reduce larger numeric ranges and redundant noise within our graph. Cross-validation was used to find the mean accuracy of our data, which was high sitting at 0.99%.
We can see in the graph of histograms, each mini graph represents one of the features given for the coin to where we see statistics for each of the coins within our dataset. We can see that the data is skewed to the left for most of them except the last one which is the memecoin feature. This data shows that we have a common “typical value” for each feature which indicates we have a bound (upper bound in this case since the graph skewers to the left).

PCA was applied to the small data set to reduce the text data features we had significantly. This data set included text data of 30 memecoins and 50 non-memecoins. Despite the success of this implementation, we still found this data to be ultimately useless since the data plotted showed insignificant differences between the two groupings. There were a couple of noisy data within the graph but the we didn’t use the information gained from this to help classify our data.

Discussion
One of the biggest issues we encountered was collecting good consistent data, and combining the data we had without any overlap. The best websites had the least amount of tokens available to us whereas the websites with a surplus of tokens usually lacked information on that token relevant to the needed respective features of the token.
With that, we took time again to reflect on this issue and make the necessary adjustments going further into our project. We have decided to create a “memecoin” classifier using supervised and unsupervised machine learning techniques combined with rigorous dimensionally reductions to give us a great predictive model. For supervised learning, we used SVM (support vector machine) for our analysis and for unsupervised learning, we used PCA but applied it to our newly updated dataset.
The feature analysis and correlation analysis done show that the coingecko_rank, whitepaper, and social_media features are highly positively correlated with whether the coin is rugged or not, whereas the num_holders feature is highly negatively correlated with whether the coin is rugged or not. Using PCA and an 80/20 split, we found that our model reaches a testing accuracy of 88% with an area under the curve of the ROC graph of 0.917190. We aim to train more unsupervised and supervised machine learning models for the final report and analysis.
The SVM done was very successful and produced an accuracy of 99%. This indicates that our model was either really good or something went wrong within our application.
PCA was widely used throughout the second iteration of our project, and within both datasets. The numerical data set proved to have a more successful usage of the PCA algorithm by providing better results. The PCA performed on the text dataset was successful as well but because this data set was small, the information provided was rather useless. This indicates that the text features were overall not helpful for each of the learning techniques applied to it.
Conclusion
Our project had an original goal of detecting shitcoins in efforts to prevent new investors from getting scammed and potentially losing all of their investments. This was difficult due to the data collection process, which was the hardest portion of this project. The midterm report we created could have been improved significantly if we had a solidified dataset from the beginning. We had a lot of missing data for most of the data points, (especially the ones >$0.01) which also led to problems. We attempted to fix these issues by recollecting our dataset and changing our project goal. We realized that the original dataset had plenty of features with data that could only be found on exclusive websites. Extracting the data was hard as well since no website provided cvs or excel files. We had to use a webscraper to help extract and collect all the data, which could be prone to mistakes if done incorrectly. Despite our attempt to clean up the data and reduce the missing points, we still ended up having lost and uncollected data which resulted in us pruning the dataset. Currently, there are no reliable data sources for this problem to which better data sources can to better models which can be tested more rigorously.
Final Video
https://youtu.be/-Uar1xMweA8
References
[1] Sebastião, H., Godinho, P. Forecasting and trading cryptocurrencies with machine learning under changing market conditions. Financ Innov 7, 3 (2021). Retrieve.
[2] Bitcoin, B. (2021). Shitcoin Due Diligence. Retrieve.
[3] Riley, Z. (2021). What are “Shitcoins”? How to find & Avoid in Cryptocurrency Market. Retrieve.